Business Health Dashboard: 5 Essential Critical Metrics
You feel like you are flying a plane through a thick fog with a broken altimeter and no fuel gauge. You are moving fast, but you have no idea if you are about to hit a mountain or if your engines are about to flame out. Every decision feels like a guess because you lack the data to prove you are actually healthy.
Let me be direct. Most service business owners manage by “gut feel” until that gut feel leads them directly into a financial ditch. You need a business health dashboard that acts as an automated early warning system for your operations. Without a functional health dashboard, you are not a CEO. You are just a high-paid firefighter waiting for the next alarm to go off. My recommendation is to stop guessing and start measuring the right things before the damage is permanent.
In the next 12 weeks, we can move you from total operational blindness to total clarity. This is not about complex spreadsheets that nobody looks at. This is about identifying operational debt signs and performing business technology audits to ensure your tech stack actually supports your growth.
The Invisible Weight of Operational Debt Signs
The reality is that most businesses are drowning in debt that does not show up on a balance sheet. I call these operational debt signs. Operational debt is the cost of “doing it later” or “fixing it with a manual workaround” because you are too busy to build a real system.
The pattern: You hire a new technician but do not have an onboarding process. You “figure it out” as you go. That is a shortcut. Every shortcut you take adds to your debt. Eventually, the interest on that debt becomes so high that your entire team spends all their time fixing mistakes instead of doing new work.
What it looks like:
- Your office manager spends four hours a day manually moving data from one software to another.
- Your field crews are constantly calling the office to ask for basic job details.
- You are seeing a high rate of “call-backs” or warranty work that eats your profit.
- Your team feels “busy” but your bank account is not growing.
These are classic operational debt signs. If you ignore these signs, your business health dashboard will eventually show a nose-dive in profitability. You cannot scale a business that is built on a foundation of manual workarounds. When you are scaling from $50K to $100K a month, these minor cracks become massive canyons.
Why it happens: Most owners prioritize sales over operations. You think that if you just sell more, the problems will solve themselves. The truth is that selling more just shines a brighter light on your broken processes. You need to identify operational debt signs early so you can pay them down before they bankrupt your culture and your cash flow.
How to handle it: You must stop and assess where the “leaks” are happening. This is where a health dashboard becomes essential. It highlights where the friction is. If your business health dashboard shows that your labor percentage is climbing while your revenue is flat, you have a massive operational debt problem in your production team.
Goal: To identify every manual process and shortcut that is currently slowing down your team.
Why Business Technology Audits Are Your First Line of Defense
You might think your software is fine because “the guys use it.” That is a dangerous assumption. Most small businesses have a “Frankenstein” tech stack. You have one app for scheduling, another for invoicing, and a spreadsheet for tracking leads. None of them talk to each other. This is why you need regular business technology audits.
A business technology audit is a deep dive into every tool your team uses to run the business. We look for redundancy, data silos, and “zombie” subscriptions that you are paying for but not using. More importantly, we look for where data is being lost. If your sales team enters data into a CRM and the production team has to re-enter it into a project management tool, you are failing your business technology audits.
The pattern: I see owners buying the “shiny new tool” because a Facebook ad promised it would fix their lives. Tools do not fix broken processes. Tools automate existing processes. If your process is a mess, the tool just makes the mess happen faster. This is a common finding during our business technology audits.
What you provide: During the audit phase, you provide access to your software, your billing statements, and your team’s daily workflows. We look at how the data flows. Does the information from the field reach the office in real-time? If not, your business health dashboard will always be out of date.
The reality: A business health dashboard is only as good as the data feeding it. If your team is not using the tech correctly, your dashboard is lying to you. This is why business technology audits are non-negotiable. We have to clean the pipes before we can measure the flow.
How to handle it: We map out the “Life of a Job.” We look at every touchpoint where technology is used. If there is a manual step, we automate it. If there is a tool that does not integrate, we replace it. The goal of business technology audits is to create a seamless data loop that feeds your business health dashboard automatically.

Designing Your Business Health Dashboard for Maximum Impact
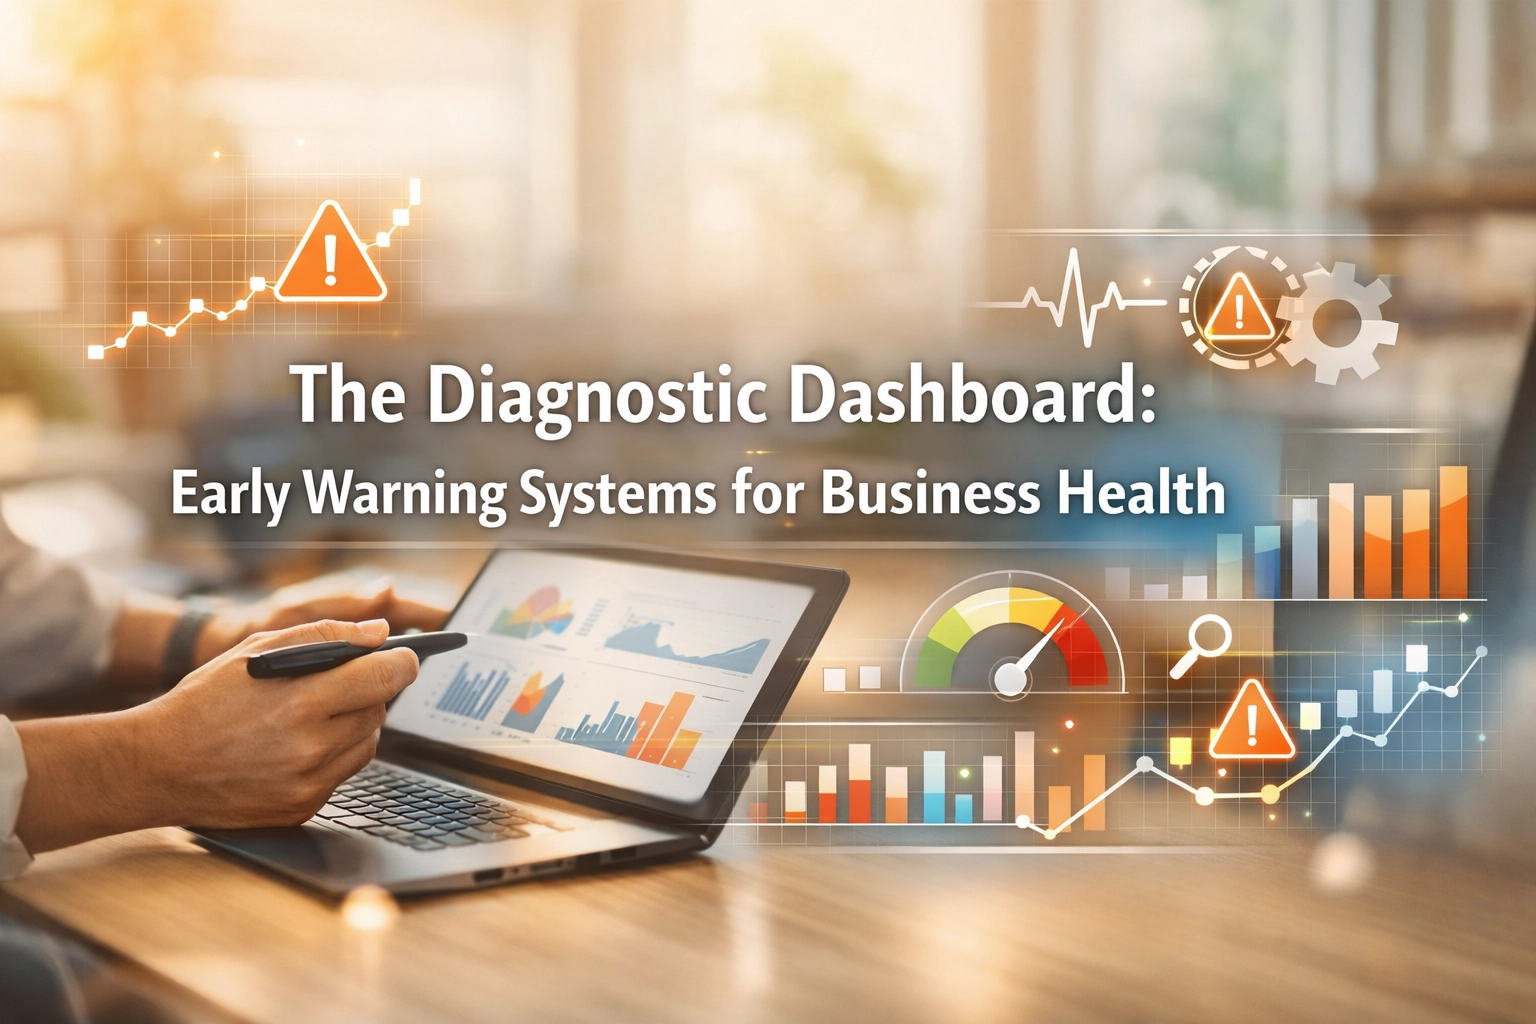
Now that we have cleared the debt and audited the tech, we build the actual business health dashboard. This is your cockpit. It should tell you exactly how the business is performing in 30 seconds or less. You should not have to ask your office manager for a report. You should just look at the business health dashboard.
A high-performing business health dashboard tracks four major areas:
- Marketing and Sales (Are the leads coming in and are we closing them?)
- Production and Efficiency (Are the crews hitting their time targets?)
- Finance and Cash Flow (Is the money actually hitting the bank?)
- Quality and Customer Satisfaction (Are we doing the job right the first time?)
The logic: If any one of these areas is red, the whole business is at risk. For example, if your sales are through the roof but your production efficiency is low, you are going to have a massive backlog and angry customers. Your business health dashboard will scream at you that you need to hire more crews or fix your scheduling.
What happens: Without a business health dashboard, you only see the problem when it is too late. You see the “red” when the bank account is empty or when your best technician quits because they are overworked. The business health dashboard allows you to see the “yellow” warnings weeks before they turn red.
Success metrics:
- Real-time visibility into job costs.
- Lead-to-close ratios updated daily.
- Labor burden tracked per crew.
- Accounts receivable aging visible at a glance.
A business health dashboard is the core of The Clarity Transformation. We don’t just give you a template. We build the data architecture so that your business health dashboard is accurate and actionable. This is part of the Clarity Operational Partnership where we act as your fractional COO to ensure the data stays clean.
Goal: To create a single source of truth that allows the owner to step back from daily micromanagement.
The Reality of Scaling Past $100K a Month
Scaling a business is like adding more weight to a bridge. If the bridge has structural issues, adding more weight will make it collapse. Many owners try to scale before they have identified their operational debt signs. They try to grow while their tech is a mess.
The pattern: You hit $80K a month and everything feels like it is breaking. You are working 70-hour weeks. Your phone never stops ringing. You feel like you are the only one who knows how to fix things. This is the “Founder Bottleneck.” The only way out is through a business health dashboard that empowers your team to make decisions based on data, not your intuition.
Honest assessment: You cannot manage 20 people the same way you managed 5. You need systems. You need a business health dashboard that flags issues so you don’t have to go looking for them. If you are constantly performing “random acts of management,” you are not ready to scale.
Here is what nobody tells you: Building a business health dashboard is hard work. It requires you to confront the reality of your numbers. Sometimes the data shows that your favorite service line is actually losing you money. Sometimes it shows that your most senior tech is actually your least productive. The Clarity Transformation is about facing these truths and making the hard calls.
When we engage in a Clarity Operational Partnership, we don’t just look at the surface. We dig into the root causes of your operational debt signs. We conduct business technology audits that reveal where your profit is leaking. Then, we plug those leaks and build the business health dashboard that protects your future growth.

How Clarity Ops Engine Fixes the Chaos
At Clarity Ops Engine, we specialize in taking businesses from operational chaos to streamlined efficiency. We do this through a hands-on approach. We don’t just send you a report and wish you luck. We get into the “engine room” with you.
The process starts with identifying your operational debt signs. We look at the “hidden” work that is slowing your team down. Then, we perform comprehensive business technology audits to ensure your software is an asset, not a liability. If your tech is broken, your business health dashboard will be useless. We fix the tech first.
Phase 1: Diagnosis (Weeks 1-3). We identify the operational debt signs and complete the business technology audits. We find the “bleeding” and stop it.
Phase 2: Systemization (Weeks 4-8). We build the processes and automate the data flow. This is where we lay the groundwork for your business health dashboard.
Phase 3: Implementation (Weeks 9-12). We roll out the business health dashboard to your leadership team. We train them on how to read it and how to take action based on the data.
This is the essence of The Clarity Transformation. It is a 12-week sprint to reorganize your operations for massive scale. Throughout this process, a Clarity Operational Partnership provides the strategic oversight you need to stay on track. We act as your fractional COO, ensuring that the business health dashboard becomes the heartbeat of your company.
The reality check: If you don’t do this now, you will keep hitting the same ceiling. You will keep feeling burned out. You will keep wondering where the profit went. Or, you can choose to build a business that runs on systems and data. A business where the business health dashboard tells you exactly what to do next.
FAQ: Building Your Early Warning System
What is the most important metric on a business health dashboard?
The honest answer: It depends on your current bottleneck. However, for most service businesses, Job Profitability is the king of metrics. If you don’t know exactly how much profit you made on every single job after labor, materials, and overhead, your business health dashboard is incomplete.
How often should I review my business health dashboard?
You should look at your high-level business health dashboard daily. Your leadership team should have a deep-dive review weekly. This prevents operational debt signs from accumulating unnoticed for months.
Can I build a business health dashboard myself?
You can, but the math usually doesn’t work out. I’ve seen owners spend 40-60 hours trying to get two software programs to talk to each other, only to have the integration break a week later. A Clarity Operational Partnership handles the technical heavy lifting so you can focus on leading.
What if our team hates using technology?
This is a common finding in business technology audits. Usually, it is because the tech is too complicated or doesn’t actually help them do their jobs. We focus on “frictionless” data entry. If the tech makes their lives easier, they will use it. If they don’t use it, your business health dashboard will fail.
How do business technology audits save money?
The logic: Most companies are paying for “seat licenses” they don’t use or software that has 80% overlap with another tool they already own. During our business technology audits, we typically find $500-$2,000 a month in “zombie” software costs that can be eliminated immediately. This often pays for a large portion of our services.
What are the biggest red flags for operational debt signs?
Look for the “Shadow Office.” This is when your team starts using their own personal spreadsheets or paper notes because the official system is too hard to use. These are massive operational debt signs. It means your data is scattered and your business health dashboard is currently blind to half of your operations.
Conclusion: The Binary Choice
You are at a crossroads. You can continue managing your business based on how loud the latest fire is screaming. You can keep ignoring the operational debt signs and hope that your tech stack magically fixes itself. You can keep wondering why your bank account doesn’t reflect your hard work.
Or, you can choose clarity. You can decide that today is the day you stop guessing. You can commit to the business technology audits required to find the truth. You can build a business health dashboard that gives you the confidence to scale, hire, and eventually step away from the daily grind.
The path to scaling from $50K to $100K a month and beyond requires a different version of you and a different version of your business. It requires the structure of The Clarity Transformation. It requires the steady hand of a Clarity Operational Partnership.
If you are ready to stop the chaos and start leading with data, let’s talk.

Option 1: Continue the grind. Keep fighting fires and hope for the best.
Option 2: Build the engine. Set up a call to discuss how we can implement your early warning system.
Schedule your consultation here: https://calendly.com/sdrobinson8/30min
Related Blogs
- Scaling Past $100K: The Operational Blueprint
- What Does a Fractional COO Actually Do?
- How to Fix Chaotic Operations in 12 Weeks
- The Founder Bottleneck: How to Step Back