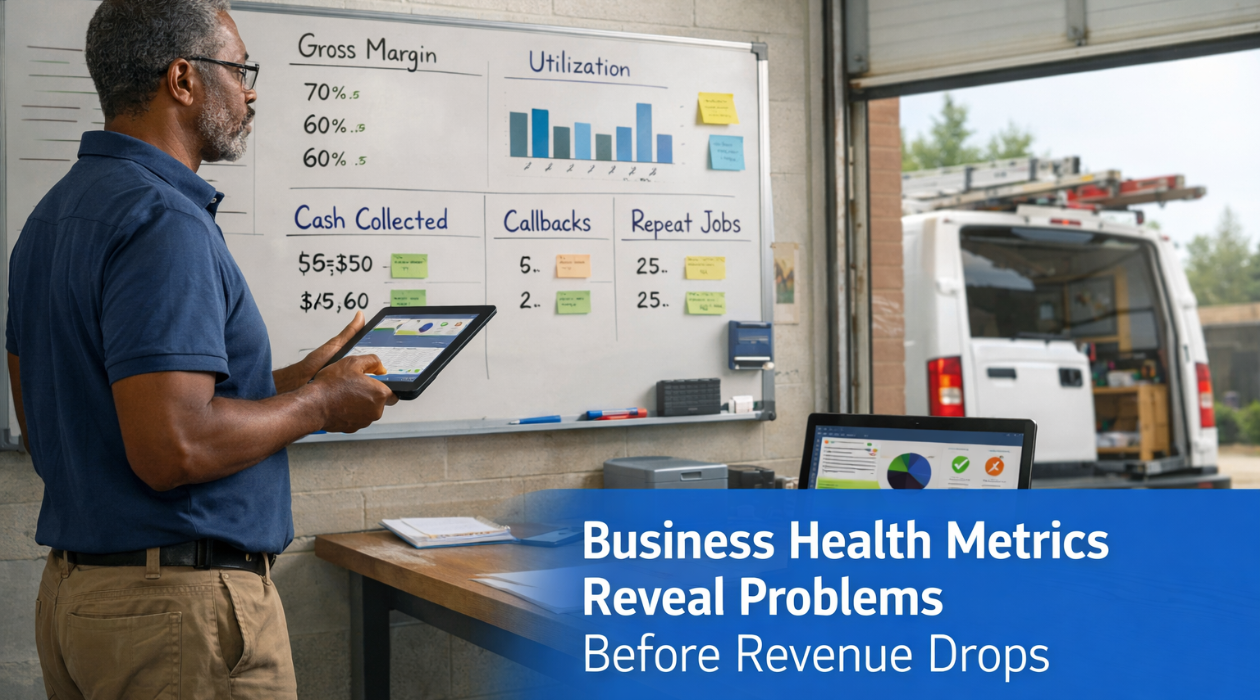
Business Health Metrics: 7 Critical Warning Signs to Track
Your garage door business is producing revenue. Trucks are rolling. Technicians are installing and repairing.
From the outside, everything looks fine.
But many garage door companies fail while revenue still looks healthy. The reason is simple: revenue alone does not reflect business health.
Business health metrics act as early-warning indicators. They reveal operational, financial, and customer-experience problems before cash flow collapses, complaints spike, or key technicians walk out the door.
Most garage door company owners wait until these crises hit before they realize something’s wrong. By then, fixing the problem costs ten times more than preventing it would have.
This guide explains the seven most critical business health metrics for garage door repair and installation companies, what healthy ranges look like, and which warning signs require immediate action.
What Are Business Health Metrics?
Business health metrics are measurable indicators that reveal whether your operations, finances, and customer experience are stable, scalable, or at risk.
For garage door companies, these metrics answer questions like:
- Are jobs actually profitable?
- Are technicians being used efficiently?
- Is cash collected or just promised?
- Are customers likely to call you again or refer you?
Unlike revenue, business health metrics show what is about to break, not just what already happened.
The garage door companies that scale past $100,000 monthly revenue don’t just work harder. They monitor operational health constantly. They’ve built diagnostic dashboards that show them exactly where the business is strong and where it’s vulnerable. They make decisions based on data, not gut feelings.
Most owners in the $20,000 to $100,000 revenue range know they should track business health metrics. They just don’t know which ones matter, how to collect the data, or what the numbers actually mean. This is exactly where Clarity Engine Ops helps clients build their first diagnostic dashboard. We select the right business health metrics for their specific operation and create simple systems to track them without adding hours to their workweek.
Why Revenue Alone Is a Dangerous Metric
Revenue is a lagging indicator.
You can have a $75,000 month and still be headed toward trouble if:
- Gross margins quietly drop from 42% to 31%
- Customer acquisition costs double
- Technician utilization falls below sustainable levels
Revenue hides inefficiencies until they become expensive emergencies. Business health metrics expose them early while they are still fixable.
Maybe your gross profit margin dropped because material costs increased and you didn’t adjust pricing. Maybe your customer acquisition cost doubled because your best referral source dried up. Maybe technician utilization fell because of scheduling inefficiencies.
Revenue masks these problems until they become catastrophic. Business health metrics expose them early.
When you implement proper business health monitoring, you shift from reactive crisis management to proactive problem prevention. You see trends before they become emergencies. You optimize operations based on evidence rather than hunches.
The 7 Critical Business Health Metrics for Garage Door Companies
1. Gross Profit Margin by Service Type
Gross profit margin is the single most important business health metric.
It shows how much money you keep after direct job costs including labor, materials, and subcontractors.
Formula
(Revenue − Direct Costs) ÷ Revenue × 100
Track margins separately for:
- Emergency repairs
- Scheduled repairs
- Installations
- Maintenance contracts
- Commercial work
Healthy ranges
- Installations: 45-55%
- Repairs: 50-65%
If your margins fall below these ranges, you’re either undercharging, overpaying for materials, or managing labor inefficiently.
Track this business health metric weekly, not monthly. Monthly tracking hides problems for too long. When you see gross margin dropping from 52% to 47% over three weeks, you can investigate immediately. Is a technician taking too long on standard jobs? Did a supplier raise prices without you adjusting? Are you discounting too heavily to win work?
Warning signs
- Margin drops of 5% or more in four weeks
- One service category underperforming by 10% or more
- Wild week-to-week swings with no clear cause
Many garage door business owners struggle to separate direct costs from overhead expenses, which makes accurate gross profit tracking nearly impossible. Clarity Engine Ops helps clients establish chart of accounts structures that make business health metrics like gross margin easy to calculate and trust.
2. Customer Acquisition Cost (CAC) by Channel
Customer acquisition cost measures how much you spend to win each new customer. This business health metric is critical because it directly impacts profitability and growth capacity.
Formula
Marketing spend ÷ New customers acquired
Track CAC separately for:
- Google Ads
- Referrals
- Door hangers
- Truck wraps
- Partnerships
Healthy range
Typically $85-$250, depending on job value and market
If CAC exceeds 25% of average job value, profitability is at risk.
For garage door companies, if your average installation is $1,800 and your CAC is $180, you’re in good shape. If your CAC is $450, you have a problem.
Track CAC monthly for each marketing channel. Some garage door companies discover they’re spending $3,000 monthly on Google Ads that generate four customers ($750 CAC) while their truck wraps generate six customers monthly at essentially zero marginal cost.
This business health metric becomes especially important when you’re trying to scale. If you can’t acquire customers profitably at your current volume, you definitely can’t do it at higher volumes.
Warning signs
- CAC rising 25% or more quarter over quarter
- Paid channels with CAC exceeding 25% of average job value
- Marketing spend increasing faster than customers
3. Technician Utilization Rate
Technician utilization measures how much paid time becomes billable work versus drive time, breaks, equipment issues, or waiting for assignments.
Formula
Billable hours ÷ Available hours × 100
If a technician works 40 hours and logs 28 billable hours, utilization is 70%.
Healthy range
- 65-75% sustained is healthy
- Below 60% indicates scheduling or routing problems
- Above 80% suggests burnout and quality risk
This business health metric reveals operational efficiency problems early. When utilization drops from 72% to 58% over two weeks, something changed. Maybe your dispatcher isn’t routing efficiently. Maybe job duration estimates are wrong. Maybe technicians are making multiple trips for parts they should have stocked.
Track utilization per technician, not just company averages. One tech at 85% and another at 45% indicates a training issue, motivation problem, or unfair job distribution.
Warning signs
- Below 60% for two consecutive weeks
- 20% or more variance between technicians
- Rising overtime paired with low utilization
Calculating accurate technician utilization requires timesheet systems that most garage door companies don’t have. Clarity Engine Ops implements simple tracking mechanisms that capture this business health metric without burdening technicians with complicated software.
4. Average Days to Payment
Cash flow failure kills more garage door businesses than lack of demand.
Days to payment measures how long it takes customers to pay after invoicing.
Formula
Sum of (Payment Date − Invoice Date) ÷ Number of Invoices
Healthy benchmarks
- Residential: 7-14 days
- Commercial: 30-45 days
Anything beyond these ranges indicates collection problems.
When average days to payment extends from 12 days to 23 days over two months, you’re heading toward cash flow crisis. You might not feel it yet because revenue still looks good. But you’re funding customer operations with your working capital instead of reinvesting in growth.
This business health metric connects directly to billing processes, payment terms clarity, and follow-up systems. Companies that invoice immediately after job completion, offer multiple payment methods, and follow up on overdue accounts within 48 hours maintain healthy payment cycles.
Warning signs
- Days to payment increasing 25% or more in a quarter
- 15% or more of invoices aging beyond 30 days
- Strong revenue with constant cash stress
Revenue does not equal cash.
5. Repeat Customer Rate
Repeat customer rate shows whether customers trust you enough to hire you again. For garage door companies, this business health metric indicates service quality, pricing fairness, and relationship strength.
Formula
Customers with 2+ jobs ÷ Total customers × 100
Track monthly to spot trends.
Healthy range
25-40% is healthy
Low repeat rates increase marketing dependency and reduce long-term stability.
Some garage door work is genuinely one-time (new construction installations), but repairs, maintenance, additional doors, and spring replacements create repeat opportunities.
When repeat customer rate falls from 34% to 22% over six months, you have a quality or service problem. Maybe technicians aren’t explaining maintenance needs. Maybe pricing feels unfair. Maybe follow-up communication disappeared.
This business health metric also reveals marketing efficiency. Acquiring new customers costs 5-7 times more than selling to existing customers. A company with 35% repeat rate and strong referral systems can grow with half the marketing budget of a competitor with 18% repeat rate.
Warning signs
- Repeat rate below 20%
- Year-over-year decline of 10 points or more
- Certain service types generating zero repeat business
Many garage door companies never calculate repeat customer rate because their CRM systems don’t track customer history properly. Clarity Engine Ops helps clients implement customer tracking that makes this crucial business health metric visible and actionable.
6. First-Call Resolution Rate
First-call resolution measures how often jobs are completed without callbacks or return visits. This business health metric directly impacts profitability and customer satisfaction.
Formula
Jobs completed without return visits ÷ Total jobs × 100
Include any return trip within 72 hours as a callback.
Elite performance
92-97% is elite performance
Below 85% indicates parts stocking problems, diagnostic skill gaps, or rushing through jobs.
Every callback erodes margin, utilization, and customer trust. When first-call resolution drops from 94% to 87%, your actual profit per job declines even if revenue stays constant.
This business health metric reveals training needs and operational deficiencies. If one technician runs 96% first-call resolution while another sits at 78%, you have a skills gap to address. If all technicians struggle with a specific repair type, you need better diagnostic tools or training.
Warning signs
- Below 85% sustained
- Large gaps between technicians (more than 15 percentage points)
- Increasing callbacks despite stable revenue
7. Net Promoter Score (NPS)
Net Promoter Score predicts referral behavior and future growth. This business health metric shows whether customers would recommend you to others.
Question
“On a scale of 0-10, how likely are you to recommend us?”
Calculation
% Promoters (9-10) − % Detractors (0-6)
Healthy range
- 50-70 is strong
- Above 70 is world-class
- Below 30 indicates service issues
Track this business health metric monthly with at least 30 responses for statistical relevance. NPS gives you early warning about service deterioration before it shows up in lost revenue or declining repeat customer rate.
When NPS drops from 62 to 41 over two months, investigate immediately. Read the comments. Identify patterns. Maybe a new technician needs coaching. Maybe pricing increased too aggressively. Maybe response times slipped.
This business health metric also validates operational changes. If you implement a new scheduling system and NPS climbs from 54 to 68, you made the right choice.
Warning signs
- 15-point drop in a quarter
- One service category scoring far below average
- Negative comments repeating similar themes
How to Build a Diagnostic Dashboard That Actually Gets Used
Knowing which business health metrics to track is step one. Actually tracking them consistently is step two. Most garage door company owners fail at step two.
Most garage door owners fail at tracking not because metrics are hard but because systems are overwhelming.
Start with three metrics tied to your biggest pain:
- Cash stress? Track gross margin + days to payment
- Growth problems? Track CAC + utilization
- Quality issues? Track first-call resolution + NPS
Use spreadsheets first. Habit beats software.
The goal is building the habit of checking business health metrics weekly, not creating sophisticated software systems.
Recommended review rhythm
- Weekly: utilization, first-call resolution
- Mid-month: gross margin, payments
- Month-end: CAC, repeat rate, NPS
Define what healthy looks like for your business in your market. The ranges provided here are guidelines, not absolute rules. Your target gross profit margin might differ based on your service mix and market positioning.
This is precisely where many garage door business owners get stuck. They know tracking business health metrics matters but can’t find the time or establish the systems to do it consistently. Clarity Engine Ops specializes in building diagnostic dashboards that fit into existing workflows without adding hours to the owner’s week.
Most importantly, act on what your business health metrics reveal. Tracking numbers without making changes is useless. When gross margin drops, investigate and fix the root cause. When technician utilization falls, optimize scheduling. When NPS declines, improve service quality.
Common Mistakes That Make Business Health Metrics Useless
The biggest mistake garage door business owners make with business health metrics is tracking vanity metrics instead of actionable ones. Total revenue, total jobs completed, and social media followers might feel good, but they don’t tell you whether the business is healthy.
Other critical mistakes:
- Measuring inconsistently (spotty data hides trends)
- Tracking too many metrics at once (leads to burnout)
- Using incorrect formulas (wrong numbers create wrong decisions)
- Ignoring context and targets (metrics need comparison points)
- Confusing correlation with causation (examine metrics in combination)
- Freezing instead of acting (paralysis by analysis)
Metrics exist to guide decisions, not replace them.
Establishing Your Baseline
Before you can use business health metrics as early warning systems, you need to establish your baseline. What’s normal for your garage door business right now?
Spend one month only measuring, not fixing.
Your numbers may surprise you:
- Margins lower than expected
- Slower payments than assumed
- More callbacks than admitted
That’s not failure. That’s visibility.
Don’t panic. These business health metrics now give you clear improvement targets. You know exactly where the business is weak and how much room exists for improvement.
Set incremental targets. Improvement compounds.
If gross margin is currently 38%, don’t target 55% in 90 days. Target 42% in 90 days, then 46% in the following 90 days.
Track your business health metrics against baseline weekly. This shows whether changes you’re implementing are working.
Setting meaningful baselines and realistic improvement targets requires operational expertise that most garage door business owners don’t have time to develop. Clarity Engine Ops works with clients to establish baseline business health metrics, identify realistic improvement opportunities, and build action plans that deliver measurable results.
Celebrate improvements even when you haven’t reached ideal ranges yet. Moving first-call resolution from 76% to 84% is real progress worth acknowledging, even though 94% is the ultimate target.
Turning Warning Signs Into Action
Your diagnostic dashboard flashes red. One of your business health metrics crosses into warning territory. Now what?
When a metric turns red:
Verify the data
Sometimes business health metrics appear problematic because of measurement errors or unusual circumstances
Identify the root cause
Business health metrics show symptoms, not diagnoses. Dig into underlying reasons
Form a hypothesis
What’s causing the problem and what might fix it?
Test one change
Don’t overhaul everything immediately. Make one change, track results for three weeks
Track results
See whether the metric improves
Document what worked
Record what you changed and why it worked for future reference
Metrics show where to look. Process fixes determine how to recover.
Consider whether you need outside expertise. If business health metrics reveal problems you don’t know how to fix, seeking help early prevents months of expensive trial and error.
The Diagnostic Dashboard in Action: Real Scenarios
Scenario one: Your gross profit margin business health metric has declined from 51% to 44% over eight weeks. Investigation reveals material costs increased 9% but you haven’t adjusted pricing. You raise installation prices 6% and repair prices 4%. Within four weeks, gross margin recovers to 48% and you’re tracking toward 50%.
Scenario two: Your customer acquisition cost business health metric for Google Ads increased from $165 to $312 over three months. Analysis shows cost per click remained stable but conversion rate dropped from 8.2% to 4.1%. You review ad copy and landing pages, discover competitors are now offering financing prominently and you’re not. You add financing information to ads and landing page. Conversion rate climbs back to 7.3% and CAC drops to $182.
Scenario three: Your technician utilization business health metric shows one tech at 81% and another at 52% consistently. You shadow both technicians for a day. The 81% tech carries comprehensive parts inventory on his truck and completes most jobs in one visit. The 52% tech makes frequent trips to the warehouse for parts, killing four hours weekly. You implement better truck stocking for the second tech. His utilization climbs to 69% within three weeks.
Scenario four: Your repeat customer rate business health metric has fallen from 31% to 19% year over year. You survey recent customers and discover no one is following up about annual maintenance. You implement automated six-month follow-up emails offering spring/fall inspections. Repeat customer rate climbs to 26% over the next six months.
Scenario five: Your days to payment business health metric extends from 13 days to 27 days over one quarter. Review of accounts receivable reveals inadequate follow-up on overdue invoices. You implement a collections calendar: 7-day reminder, 14-day phone call, 21-day final notice. Days to payment returns to 15 days within eight weeks.
These scenarios show how business health metrics function as early warning systems. Problems surface when they’re still manageable. Solutions are clear because data points to root causes. Results are measurable because you track the same business health metrics before and after changes.
Frequently Asked Questions
What are business health metrics?
They are measurable indicators that reveal operational, financial, and customer-experience stability before revenue declines. Business health metrics show what’s about to break, not just what already happened.
How many metrics should I track at first?
Three. Add more only after tracking becomes habitual. Start with metrics tied to your biggest pain point (cash stress, growth problems, or quality issues).
What’s a healthy gross profit margin for garage door installation and repair?
Healthy gross profit margins typically range from 45-55% on installations and 50-65% on repairs. If your margins fall below these ranges, you’re likely undercharging, overpaying for materials, or managing labor inefficiently.
Can spreadsheets work?
Yes. Sophisticated tools only matter after consistency is proven. The goal is building the tracking habit, not implementing complex software.
What technician utilization rate is realistic for garage door companies?
65-75% sustained is healthy. Below 60% indicates scheduling or efficiency problems. Above 80% suggests you’re pushing too hard and risking burnout or quality issues.
How often should I review my business health metrics dashboard?
Review operational metrics (utilization, first-call resolution) weekly, financial metrics (gross margin, days to payment) mid-month, and customer metrics (repeat rate, NPS, CAC) at month-end. Consistency matters more than frequency.
What’s the fastest way to improve customer acquisition cost?
Focus on channels with the lowest CAC and highest quality customers. Many garage door companies waste money on channels with $400+ CAC when referral programs and truck wraps deliver customers at $50-150 CAC.
How do I calculate Net Promoter Score for my garage door business?
Ask customers after each job: “On a scale of 0-10, how likely are you to recommend us?” Subtract the percentage of detractors (0-6 ratings) from the percentage of promoters (9-10 ratings) to get your NPS.
Take Control of Your Garage Door Business Health
You cannot fix what you cannot see.
Business health metrics transform garage door companies from reactive firefighting to proactive leadership.
Tracking even three of these metrics will reveal improvement opportunities you are currently missing.
The seven business health metrics outlined in this guide give you complete visibility into operational efficiency, financial performance, and customer satisfaction.
But knowing which business health metrics to track is only half the battle. Actually implementing diagnostic dashboards, establishing measurement systems, and building action plans based on the data requires operational expertise and time most garage door business owners don’t have.
If you want help implementing a diagnostic dashboard without adding hours to your week, Clarity Engine Ops specializes in building operational visibility for service businesses in the $20K-$100K monthly revenue range. We help you identify which business health metrics matter most for your specific operation, implement simple tracking systems that don’t add hours to your week, and turn data into actionable improvements.
Discover which business health metrics matter most for your operation and how to implement them in the next 90 days.
Keep Reading:
- Process Documentation for Garage Door Companies: Creating Systems That Scale
- The 12-Week Transformation: How Garage Door Companies Fix Broken Operations
- Cash flow management: 7 brutal ways to stop losing profit
- Technician Performance Management: Metrics That Drive Excellence
- When to Hire Your First Operations Manager (And What They Should Track)
- Garage Door Profit Margins: Why Revenue Can Hide Serious Problems
- How to Spot Profit Leaks in a Garage Door Company Before They Get Worse
- The Real Cost of Running a Garage Door Business Nobody Talks About
- Why Busy Garage Door Companies Still Struggle With Cash Flow
- How to Build Financial Visibility Into Every Garage Door Job
- Garage Door Job Costing: How to Know If a Job Actually Made Money
- Why Garage Door Companies Underprice Repairs Without Real Cost Data
- How to Track Labor, Parts, and Margin by Service Type
- Garage Door Pricing Mistakes That Quietly Kill Profit
- Why Gross Profit by Service Type Matters More Than Total Revenue
- Technician Performance + Capacity
- Technician Utilization for Garage Door Companies: What Healthy Really Looks Like
- Why Garage Door Techs Stay Busy but Billable Hours Stay Low
- How to Improve Garage Door Technician Efficiency Without Burnout
- Garage Door Dispatch Problems That Hurt Utilization and Profit
- How to Measure Technician Performance Without Guessing
- Days to payment: 5 brutal ways to fix your cash flow
- Why Strong Revenue Does Not Mean Strong Cash Flow
- Late Payment Reduction: 7 Massive Ways To Kill Cash Gaps
- Invoicing Systems: 5 Proven Ways To Fix Brutal Cash Flow
- Accounts receivable: 7 critical red flags you must fix
- Repeat Customer Rate: 7 Proven Ways to Boost Stability
- Why Garage Door Companies Lose Repeat Business Without Realizing It
- How to Turn One-Time Garage Door Customers Into Long-Term Clients
- Garage Door NPS: How to Measure Referral Potential the Right Way
- Customer experience metrics: 7 Proven Ways to Boost Profits
- Customer acquisition cost: 10 proven tips to explode profit
- Marketing channel profitability: 7 traps that drain cash
- Lowering acquisition costs: 5 secrets to double growth
- Referral system implementation: 9 proven steps for growth
- Business health data analysis: 8 proven ways to gain profit
- How to Build a Business Health Dashboard for a Garage Door Company
- The 5 Garage Door KPIs Every Owner Should Review Weekly
- Why Most Service Business Dashboards Fail to Get Used
- How to Track Garage Door Metrics Without Adding Hours to Your Week
- Data driven leadership: 9 secrets for total health