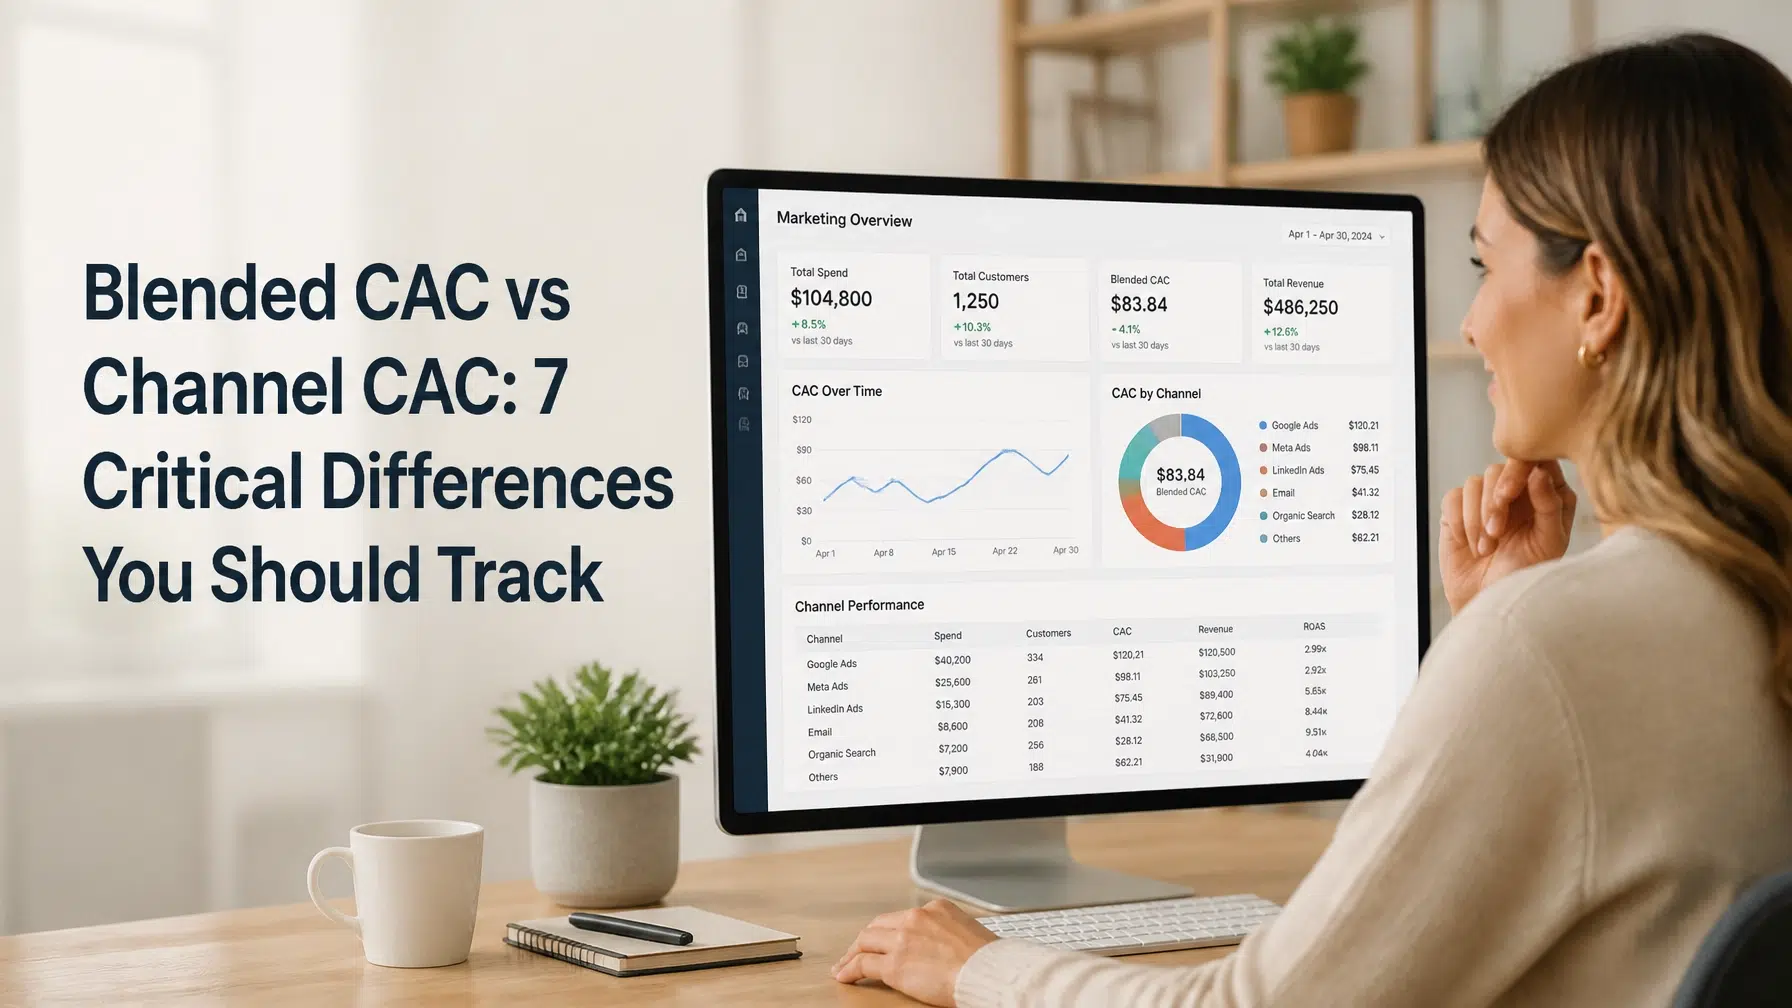
Blended CAC vs Channel CAC: 7 Critical Differences You Should Track
You are spending ten thousand dollars a month on marketing but your bank account is barely growing even though your team says the ads are working.
Let me be direct. If you only look at your total marketing spend and divide it by your total new customers, you are flying blind. This number is your average cost per lead. It tells you if you are profitable today, but it does not tell you why. Here is what nobody tells you: your business could be dying while your total numbers look healthy. You need to understand the relationship between blended CAC vs channel CAC to survive.
Most small business owners get overwhelmed by data. They see spreadsheets full of numbers and just want to know one thing. Are we making money? While that is a fair question, it is the wrong way to look at growth. Within 12 weeks of working together, I usually find that a business is overspending on one channel while neglecting a gold mine in another. You cannot fix what you do not measure correctly.
In this guide, I will break down exactly why you must track blended CAC vs channel CAC every single week. We will look at the math. We will look at the mistakes. Most importantly, we will look at how to stop the bleeding in your marketing budget.
The Logic of Blended CAC vs Channel CAC
The pattern is always the same. A business hits $1M or $2M in revenue. The owner decides to scale. They hire an agency or run more ads. Suddenly, the profit margins shrink. The owner looks at the total cost to acquire a customer. It seems okay. But deep down, something feels off. This is where the struggle between blended CAC vs channel CAC begins.
Blended CAC is your total marketing and sales cost divided by the total number of customers. It includes everything. Ad spend. Sales salaries. Software. Agency fees. It is your big picture number.
Channel CAC is the cost of one specific path to a customer. This might be Facebook Ads. It might be Google Search. It might be your referral program.
The reality: if you only track the blended number, you are hiding your failures behind your successes. You might have a referral program that brings in customers for $10 each. You might have Facebook Ads that cost $500 per customer. If your blended number is $100, you think you are doing great. You are actually losing money on every single Facebook lead.
Understanding blended CAC vs channel CAC is about seeing the truth.
Why Your Current View Is Fragile
You might think your marketing is working because you have cash in the bank. This is a common mistake. Many businesses grow for years with a broken marketing engine. They rely on word of mouth to subsidize expensive, failing ads.
When you scale, the “free” customers from referrals do not scale at the same rate as your paid ads. This is when the blended CAC vs channel CAC gap becomes a crisis. Your blended cost will skyrocket as you pour more money into the expensive channels.
Goal: To move from guessing about marketing to knowing exactly where every dollar goes.

7 Critical Differences You Should Track
Now let’s look at the specific ways these two metrics behave differently. Understanding blended CAC vs channel CAC requires looking at more than just the final dollar amount. You need to look at how these numbers influence your daily decisions.
1. The Scope of Data
The first difference in blended CAC vs channel CAC is the breadth of what you are looking at. Blended data is broad. It is the view from 30,000 feet. Channel data is the view on the ground.
At $50K a month in revenue, you can get away with the broad view. At $150K a month, the broad view becomes dangerous. You need to know if the $4,200 you spent on LinkedIn last month actually turned into a person who paid you money.
2. Decision Making Authority
Who uses these numbers? Usually, the business owner uses the blended number to see if the business is healthy. The marketing manager or agency uses the channel number to optimize ads.
The problem: if these two people are not looking at blended CAC vs channel CAC together, they will disagree on what “success” looks like. The agency might say “leads are up” while the owner says “profits are down.”
3. The Risk of the “Efficiency Trap”
The reality check is that blended numbers often lie. This is the biggest difference in blended CAC vs channel CAC. A strong referral channel can mask a failing paid ad strategy for months.
I have seen businesses find $3,800 a month in wasted spending just by separating these two numbers. They were spending money on a channel that had a 0% conversion rate, but because their overall cost was low, they never checked.
4. Scalability Insights
Can you double your business next month? Your blended number cannot answer that. Your channel number can.
If you know your Google Ads have a channel CAC of $80 and your LTV (Lifetime Value) is $400, you can scale. If you only know your blended number is $100, you don’t know which lever to pull. This is why blended CAC vs channel CAC tracking is vital for growth.
5. Attribution Complexity
Tracking blended CAC vs channel CAC is not always easy. Attribution is messy. Someone might see a Facebook ad, then search for you on Google, then click an email link.
The honest answer: you will never have 100% perfect data. But having 80% accurate channel data is better than having 100% accurate blended data that tells you nothing about where to invest.
6. Time Horizon
Blended numbers are lagging indicators. They tell you what happened last month. Channel numbers can be leading indicators. If you see your cost per click rising on one channel today, your channel CAC will be higher next week.
By tracking blended CAC vs channel CAC, you can spot trends before they hit your bank account. You can pivot faster.
7. Profit Margin Protection
Every channel has a different “ceiling.” Some channels are cheap but have very few leads. Some are expensive but have thousands of leads.
When you compare blended CAC vs channel CAC, you find your “profit sweet spot.” This is the point where you are getting the most customers possible at a price that still leaves you with a 20-30% profit margin.
Phase 1: Identifying the Channel Leak
Look at your bank statement from last month. How much did you spend on ads? Now look at your CRM. How many people actually bought?
The pattern: owners often ignore the “soft costs.” They forget to include the $2,000 a month they pay an assistant to manage the social media. They forget the $500 software fee for the email platform.
When we start The Clarity Transformation, we look at every single cent. We don’t just look at the ad spend. We look at the operational cost of managing that channel.
What you provide:
- Access to your ad accounts
- Payroll data for sales and marketing staff
- Marketing software invoices
- Your total new customer list for the last 90 days
Goal: To create a baseline for both blended CAC vs channel CAC so we can see the real truth of your business health.
This process usually takes 2-4 weeks to get right. You might think you have these numbers, but once we dig in, we often find that 20-30% of the data is missing or incorrectly categorized.

Phase 2: Optimizing the Mix
Once you have the data, what do you do with it? This is where the Clarity Operational Partnership becomes valuable. We don’t just give you a report and leave. We look at the blended CAC vs channel CAC comparison every week.
Look. Here is the thing. You don’t need more leads. You need more profitable leads.
If we find a channel where the channel CAC is $300 but the customer only brings in $400 in profit, that is a red flag. We either fix the conversion rate or we cut the channel.
Common findings:
- One “forgotten” subscription is costing $150 a month with zero use.
- An agency is reporting on “impressions” instead of sales.
- The owner is spending 10 hours a week on a social channel that produces zero revenue.
We use The Clarity Transformation to build the systems that track this automatically. You shouldn’t have to spend 5 hours a week in a spreadsheet. Your operations should feed you these numbers on a silver platter.
How Clarity Ops Engine Fixes Your Marketing Ops Chaos
I have seen this pattern dozens of times. A business grows, the operations get messy, and the owner loses track of where the money is going. They start making decisions based on “gut feeling” instead of data.
My recommendation: stop the guessing.
When I step in as your fractional COO, I don’t just look at your marketing. I look at how marketing connects to sales, and how sales connects to delivery. If you have a low blended CAC vs channel CAC but your team is drowning because they can’t handle the new leads, you still have an operational breakdown.
We fix this through The Clarity Transformation. We spend 12 weeks cleaning up your systems. We build your operations manual. We train your team. We ensure that every marketing dollar spent has a clear path to a satisfied customer.
By the end of 12 weeks, you will have:
- A real-time dashboard showing blended CAC vs channel CAC.
- Clear roles for who manages which channel.
- A documented process for auditing marketing spend.
- A team that knows exactly how to handle new growth without breaking.
If you need ongoing support, the Clarity Operational Partnership provides weekly strategy sessions. We look at your metrics together. We spot the red flags before they become disasters. We make sure you stay out of the operational chaos.
You don’t have to hire a full-time COO at $150K a year to get this level of clarity. You just need a partner who knows how to spot the waste and build the systems.
Timeline:
- Weeks 1-4: Audit and Data Cleanup
- Weeks 5-8: System Building and SOP Creation
- Weeks 9-12: Team Training and Implementation
Goal: To give you a business that runs smoothly without you being the bottleneck for every decision.

Frequently Asked Questions
What is the most common mistake when calculating blended CAC vs channel CAC?
The most common mistake is failing to include sales salaries and commissions. Many owners only look at the ad spend. If you have a salesperson who spends 40 hours a week on one channel, their salary must be included in that channel CAC. Otherwise, your data is a lie.
How often should I check my blended CAC vs channel CAC?
You should look at your blended number once a month for a high-level health check. You should look at your channel numbers weekly. If a channel breaks, you need to know in days, not weeks. This is a core part of the Clarity Operational Partnership rhythm.
Can I track blended CAC vs channel CAC without expensive software?
Yes. You can do this in a simple spreadsheet. The tool doesn’t matter as much as the discipline of the data entry. Most small businesses don’t need a $1,000 a month tracking tool. They need a 15-minute weekly habit of updating their numbers.
What is a “good” ratio for blended CAC vs channel CAC?
There is no single “good” number. However, a general rule is that your Customer Lifetime Value (LTV) should be at least 3 times your CAC. If your LTV is $1,000, your blended CAC vs channel CAC should ideally be under $333.
Why does my blended CAC look better than my paid channel CAC?
This is normal. Your blended number includes “free” customers from referrals, organic search, and word of mouth. These bring the average down. The reality is that your paid channel CAC shows you the true cost of scaling. You can’t just “buy” more referrals, but you can buy more ads.
Should I stop a channel if the channel CAC is higher than the blended CAC?
Not necessarily. If the channel is still profitable (LTV is higher than CAC), you might keep it. But if that channel is pulling your profit margins down too low, you need to decide if the volume is worth the lower profit. Tracking blended CAC vs channel CAC gives you the data to make that choice.
How does The Clarity Transformation help with these metrics?
During The Clarity Transformation, we build the actual tracking systems. We create the spreadsheets or dashboards, write the SOPs for your team to update them, and teach you how to read the data. We take the “math stress” off your plate.
You have two choices.
You can keep looking at your total bank balance and hoping for the best. You can stay in the dark about which marketing channels are actually making you money and which ones are just wasting your time. You can continue to be the bottleneck, manually checking ads and wondering why profit margins are tight.
Or, you can get clear.
You can start tracking blended CAC vs channel CAC with precision. You can build a business where the operations are documented, the team is trained, and the growth is predictable. You can step out of the chaos and back into the role of a visionary owner.
If you are tired of the guesswork and ready for hands-on implementation, let’s talk. I help small business owners like you fix their broken systems and find the wasted spending that is holding them back.
We can start with a simple 30-minute call to see where your biggest operational leaks are.
Book your 30-minute strategy session here: https://calendly.com/sdrobinson8/30min
Don’t let another month of “blended” numbers hide the truth of your business. 12 weeks from now, you could have a fully optimized operations manual and a marketing engine that you actually understand.
Related Blogs
- Why SaaS Growth Leads to Operational Breakdowns
- How a Fractional COO Fixes Your Growth Bottlenecks
- The 12-Week Transformation: What to Expect
- How to Calculate Customer Acquisition Cost Correctly
- Why Blended CAC Can Hide Failing Marketing Channels
- The Difference Between Customer Acquisition Cost and Cost per Lead
- What Expenses Should Be Included in Your CAC Calculation?
- Why Ad Spend Alone Does Not Show Your True Acquisition Cost
- How Sales Salaries and Commissions Affect Customer Acquisition Cost
- How to Calculate CAC for Each Marketing Channel
- Why Referral Customers Can Make Paid Advertising Look More Profitable
- How Organic Leads Distort Your Blended CAC
- The Hidden Cost of Managing Multiple Marketing Channels
- How to Identify Which Marketing Channels Are Actually Profitable
- Why More Leads Do Not Always Mean Better Marketing Performance
- How to Compare Channel CAC Against Customer Lifetime Value
- What Is a Healthy LTV-to-CAC Ratio for a Small Business?
- How to Know When a Marketing Channel Is Too Expensive
- When Should You Stop Spending Money on a Marketing Channel?
- Why the Cheapest Marketing Channel Is Not Always the Best One
- How to Balance Marketing Volume With Profitability
- How to Find the Profit Ceiling of Each Marketing Channel
- Why Scaling Paid Ads Can Quickly Shrink Profit Margins
- How to Build a Weekly Marketing Performance Dashboard
- The Marketing Metrics Every Small Business Owner Should Review
- How Often Should You Review Customer Acquisition Cost?
- How to Create a Marketing Spend Audit Process
- Why Marketing Agencies and Business Owners Disagree About Results
- How to Define Marketing Success Beyond Clicks and Impressions
- Why Lead Generation Reports Do Not Tell the Whole Story
- How to Connect Marketing Data to Sales Revenue
- How Poor CRM Data Leads to Bad Marketing Decisions
- How to Improve Marketing Attribution Without Expensive Software
- What to Do When Customers Interact With Multiple Marketing Channels
- Why Perfect Marketing Attribution Is Not Necessary
- How to Track Customer Acquisition Cost in a Spreadsheet
- Who Should Be Responsible for Updating Marketing Metrics?
- How to Create an SOP for Tracking Marketing Performance
- Why Marketing Automation Cannot Fix Bad Data
- How to Prepare Your Operations for an Increase in Leads
- Why Profitable Marketing Can Still Overwhelm Your Team
- How to Scale Customer Acquisition Without Creating Operational Chaos
- How a Fractional COO Helps Businesses Build Profitable Marketing Systems